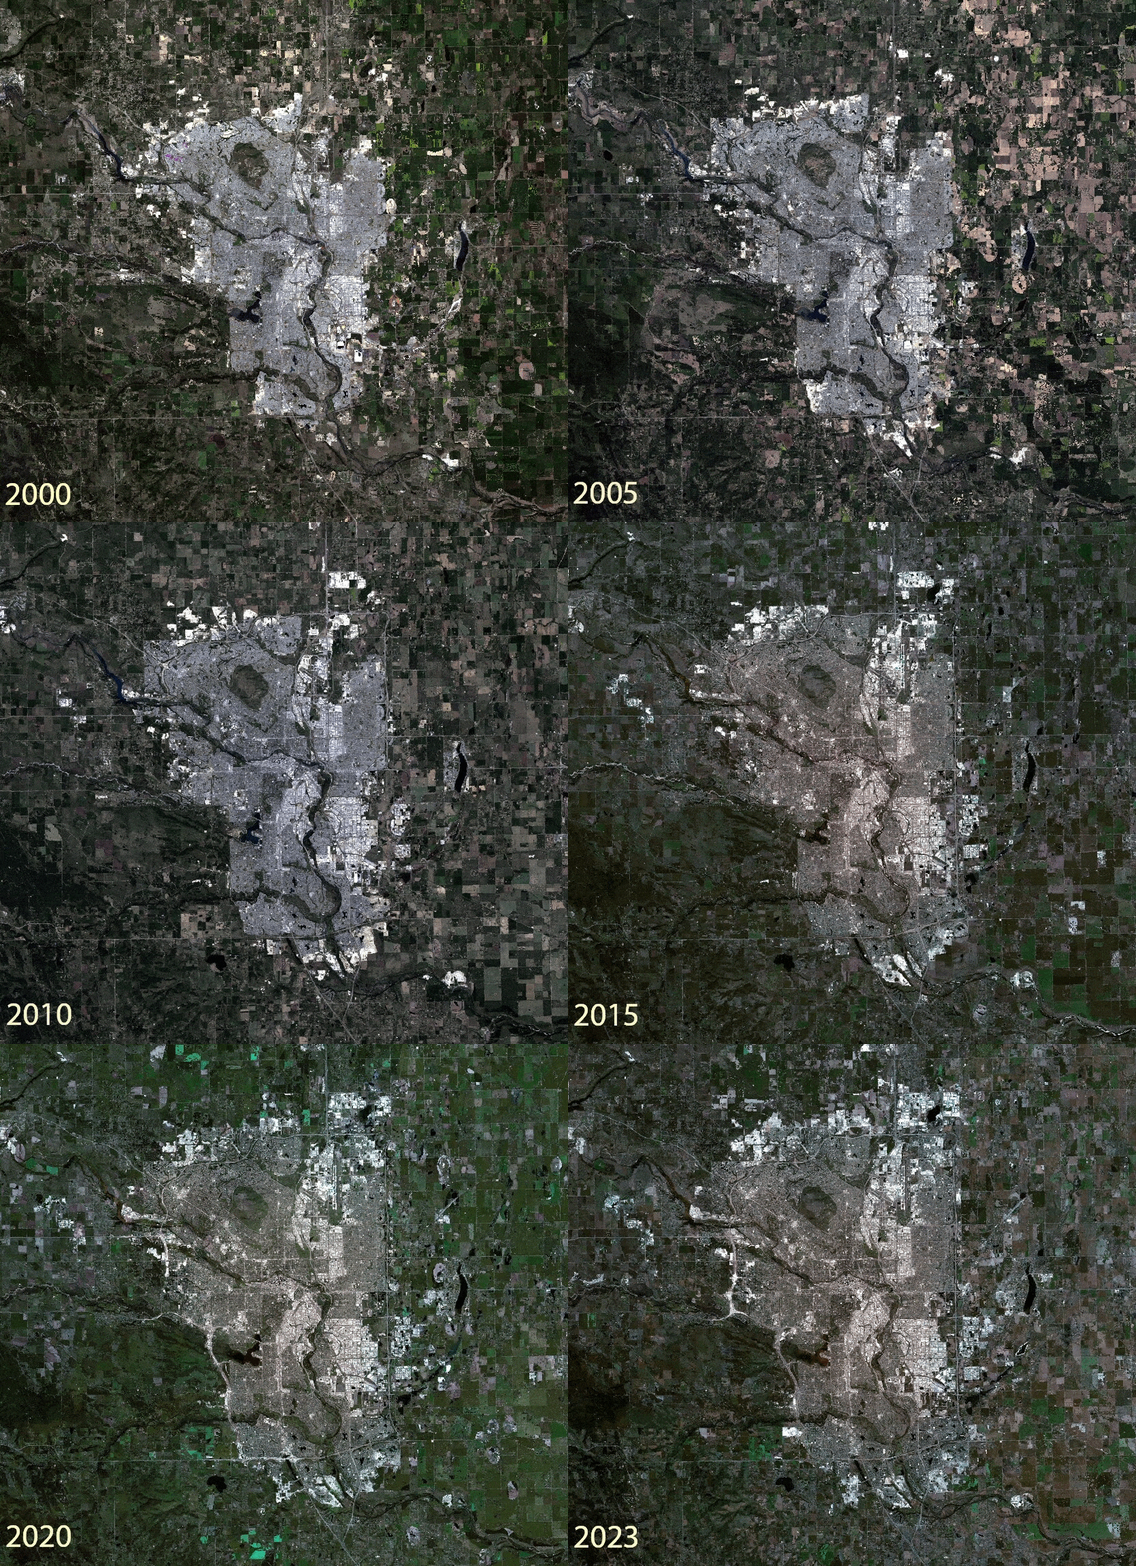
Calgary, Alberta is once again one of the fastest growing cities in Canada. With a constantly evolving city skyline, and growing community boundaries, our team at Caslys thought it would be interesting to apply our landscape change tools to see what’s been happening. We utilized Landsat satellite imagery and our new Caslys Analysis Ready Data (CARD) Stack processes, to explore the change in landscape across Calgary over the past 20+ years. The results are included in the article below, highlighting the overall expansion that the city is experiencing.
With a strong job market and diverse amenities, Calgary is an attractive place to be and is recently one of the fastest growing metropolitan areas in Canada. Between 2022 and 2023, Calgary experienced the largest population increase in the country, surpassing 1.6 million people. We applied a few analysis methods to see what the growth distribution looks like on the landscape. There have been some significant growth spurts over the last couple decades. While suburban growth into the agricultural outskirts remains a common theme as you can see in the animation below, there are also new communal green spaces within the city.

Development Milestones
In 2013, Calgary moved forward with highway construction in two areas, developing the “Ring Road”. It’s part of a larger east-west/north-south trade corridor, and enhances the city’s accessibility. Improved transportation infrastructure helps connect the four quadrants of the city and links the new communities that are developing on the outskirts of Calgary. A projected 17 new neighbourhoods surrounding the city within the 2024 Area Structure Plans and Citywide Growth Strategy were announced. Within the downtown area of Calgary, further transportation development continues to push forward with additional light rail transit lines (LRT) being added to help commuters throughout the city. Olympic Plaza and the Eau Claire Market area are current restoration projects, enhancing green space in the downtown core. These developments help sustain rapid population growth in many ways, while also reshaping the physical landscape of the city.
Change Detection
Change detection often represents a comparison between two points in time, as the availability of time series data can be limited. Now that multiple satellites are providing observations every few days globally, and computing power continues to increase, regular monitoring of landscape change is now a practical prospect.
Regular change monitoring is advantageous as it allows for a more precise characterization of the timing of changes, enabling better interpretations to be made on current high quality data. Identifying the timing of change enhances our ability to determine the drivers of change by visualizing the landscape before and after each point in time. More importantly, this mapping approach allows for monitoring in near real-time with changes being detected shortly after additional satellite images are acquired.
LandTrendr
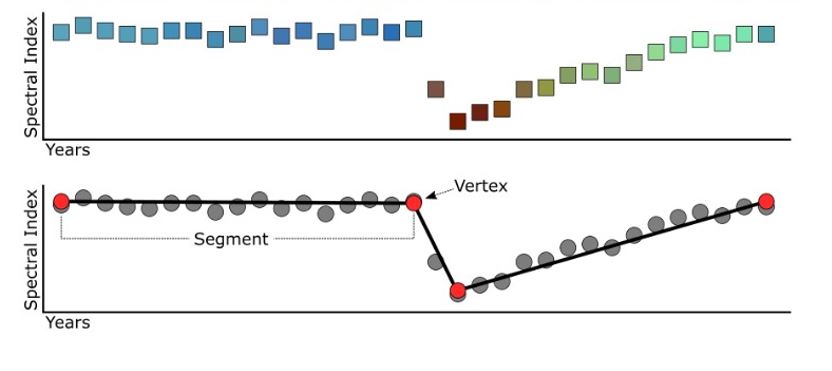
Landsat-based detection of Trends in Distribution and Recovery (LandTrendr) is an approach developed specifically to take advantage of the wealth of information available within a time series of Landsat images (Kennedy et al. 2010). The approach is based on the concept of temporal segmentation, where an image time series is divided into segments defined by abrupt changes in spectral signature. Between the abrupt changes, a slope is fitted for each segment (Figure 2) to capture the gradual recovery. The figure below illustrates the application of Landtrendr to a theoretical location that was stable for many years, then underwent a significant and abrupt event, followed by gradual recovery. Landtrendr has been used for many applications, such as:
- Attribution of disturbance change agents
- Insect infestation detection
- Forest change detection
- Land cover change detection

To explore landscape change for Calgary, we utilized NDVI to highlight change in vegetation greenness. This allows us to see where vegetation greenness has been significantly changed, a strong indicator for urban development but also important to monitor change in more natural settings. We used LandTrendr to identify NDVI breakpoints in a Landsat time series for 2000 to 2023 separating subsequent recovery. These breakpoints, defined by year and NDVI value, allow us to characterize landscape change pixel by pixel to develop a better understanding of how and when and where Calgary is changing.

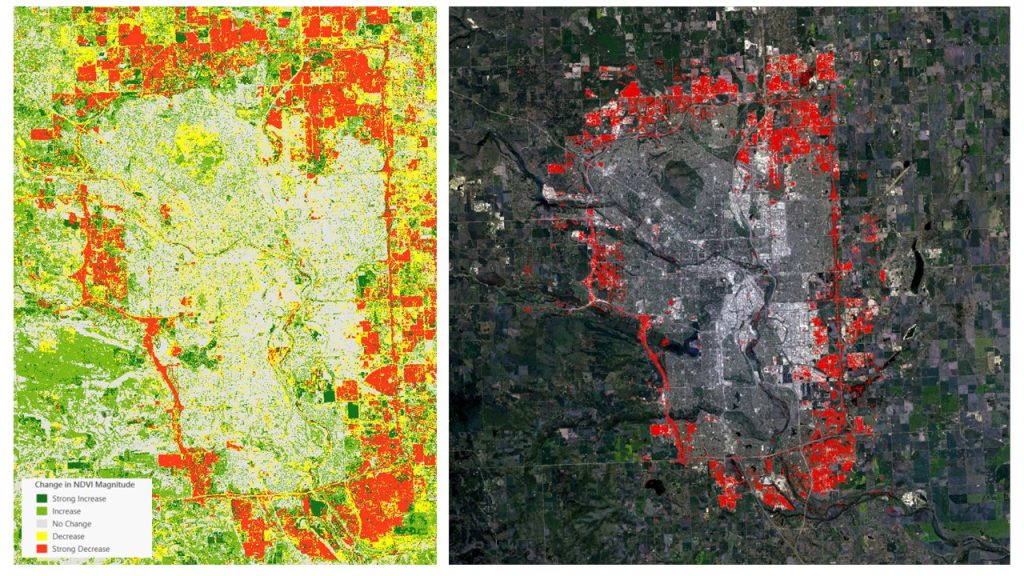
Figure 3: Left – Results from LandTrendr Showing Overall Magnitude of NDVI Change Right – Strongest Magnitude of Negative Change
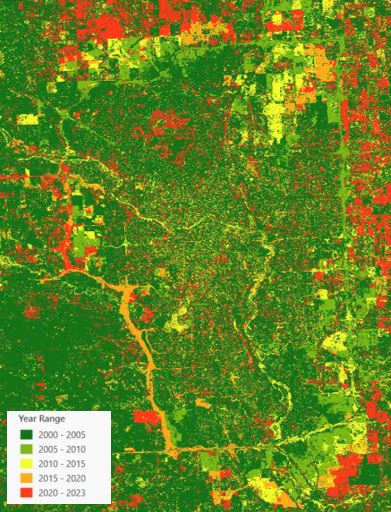
In this quick review of our Calgary results, we highlight the magnitude and temporal breakdown of change in NDVI values across the city since the year 2000. The city’s development of their highway systems appear to be the largest driving force influencing change. The development of the Ring Road in the NE and SW regions of Calgary were both followed by substantial urban developments highlighted in Figure 3. The temporal signatures of NDVI change are symbolized in Figure 4, showcasing the progression of NDVI change events. Having the ability to monitor multiple years of Landsat imagery enables us to pinpoint when the change occurred and what its drivers might be. Note that all new major roads are built in the earlier observations followed by outward expanding changes to NDVI at the edges of the city. These LandTrendr results make it apparent that the growth in the suburban communities around the city of Calgary is driven by the connectivity of the city via major transportation routes, and will most likely continue to push the city limits outwards.

One consideration for using Landsat imagery for change detection is that the resolution is best suited for regional and landscape level monitoring and analysis. However, the results presented here integrate well with LiDAR and other high-resolution imagery to more precisely map finer scale areas of interest.
Learn more about CARD Stack today!
The information presented integrates well with LiDAR and other high-resolution imagery to more precisely map the landscape. The Caslys CARD Stack team is excited to help our customers accomplish their geospatial tasks in a fast and efficient manner. For pricing inquiries, product details, and more info on how CARD Stack can help fulfill your project needs, click here or follow the link below.
CARD Stack website: https://www.caslys.ca/cardstack/
References
Kennedy, R. E., Yang, Z., & Cohen, W. B. (2010). Detecting trends in forest disturbance and recovery using yearly Landsat time series: 1. LandTrendr—Temporal segmentation algorithms. Remote Sensing of Environment, 114(12), 2897-2910.
About Caslys
For over 20 years, Caslys Consulting Ltd. has taken pride in offering a wide range of high-quality geospatial services for both environmental and natural resource management industries.
Our focus is on interpreting and analyzing data to deliver cost-effective solutions and help our clients make better informed decisions. We specialize in Geographic Information Systems (GIS), remote sensing, information management and application development to meet the needs of both public and private sector clients within Canada and abroad.
As a company, Caslys Consulting combines strong technical skills in our specialized fields with the ability to effectively communicate technical results and complex products to help show our clients how it can be used for meaningful decision making. We also understand the importance of sustainability and take pride in promoting sustainable initiatives and practices to help improve the communities we are working in.
Caslys Consulting Ltd. acknowledges and respects the Lək̓ʷəŋən peoples and W̱SÁNEĆ Nations on whose traditional territory the Caslys office is located. We thank them for their strength and resilience in protecting this land and aspire to uphold our responsibilities according to their example.
We want to hear from you! Connect with Caslys today to learn more about our services and how our spatial data specialists can help your projects succeed.