In this article, we explore how Relative Earth Models (REMs) can be used to visualize floodplains. Fluvial environments have significant natural and anthropogenic roles. Rivers are key features that shape our natural environment and create important ecological habitats. Additionally, they have numerous uses, including those relating to transportation, hydroelectricity, and recreational activities. While many reasons may attract us to them, these dynamic environments can also repel us with flood events and the dramatic hydrodynamic forces that shape rivers – the recent landslide event in the Chilcotin River (located in the Cariboo Regional District, British Columbia) being an example of such forces at play. This duality makes fluvial environments an important subject of study.
The Role of Topography in River Systems
Topographic data is often represented by a Digital Elevation Model (DEM), where an elevation value is assigned to each pixel in an image. These values can represent the ground or bare earth as in the case of a Digital Terrain Model (DTM). Due to river systems flowing downhill, a decreasing trend will be present in the elevation values of the DTM. Within these trending elevation values, there are smaller topographic features that make up the river corridor. These features play a significant role in the river’s hydraulics and will influence the way in which sediment is eroded or deposited.
Floodplain Visualization with Relative Earth Models

A technique used to better understand these topographic variations is a Relative Earth Model (REM) or Height Above River (HAR) raster. An REM is created by removing the downward slope of the river, and leaving only the local topographic features so that the resulting elevation values are relative to the height of the river.
REMs are primarily used as a tool to visualize river corridors, and can be used to identify historic river features as well as estimate how they will evolve. Glacial and volcanic features such as recessional outwash and andesite flows are further examples of local topographic features highlighted by REM results. Additionally, REMs can act as training inputs for machine learning models, such as this one which predicted river substrate class sizes.
Case Study: Cowichan and San Juan River Floodplains
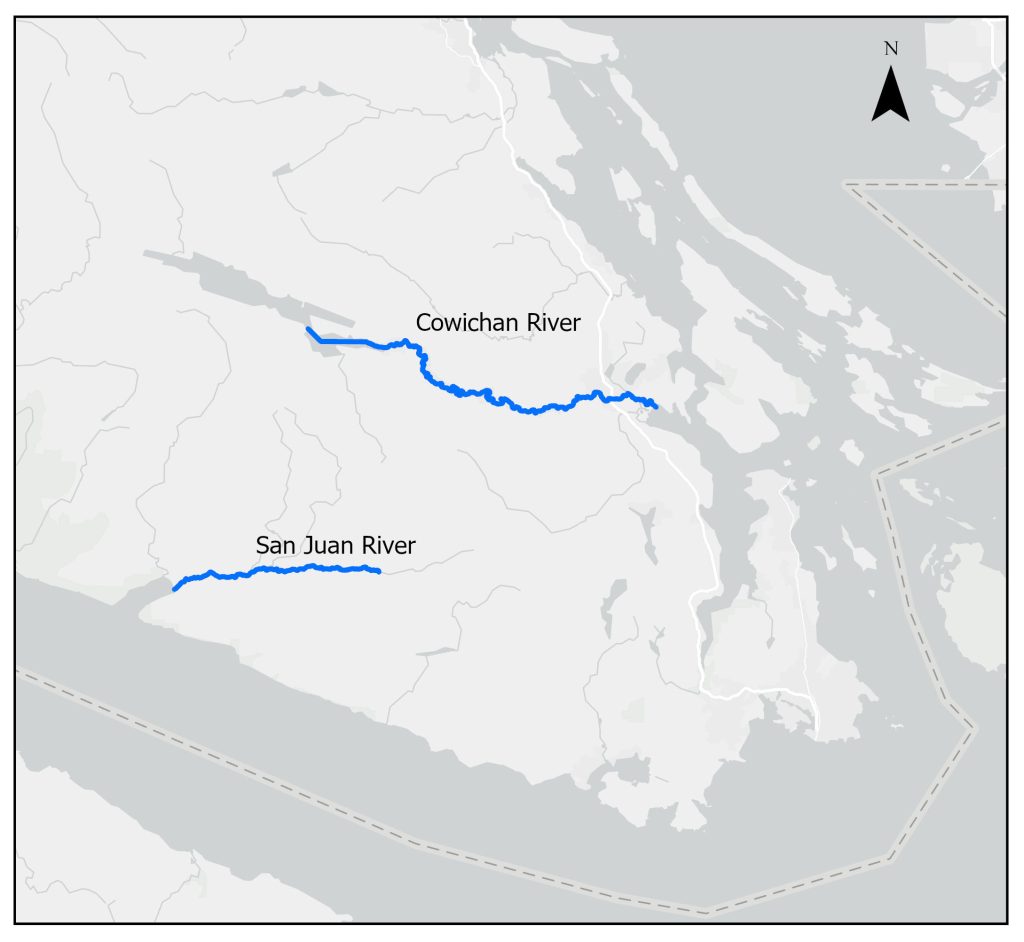
Using Lidar-based elevation data accessed from the LidarBC data portal, we have produced REMs for both the Cowichan and San Juan Rivers located on Vancouver Island.
Right: Figure 2. Areas of interest.
Applying hydrologic modelling tools, the stream centerline was first calculated. After generating points along the river centerline, the DEM was then sampled, and a height value was attributed to each point. It was then possible to interpolate a surface which represents the general slope of the river. We then normalized or ‘detrended’ the DEM to this slope by calculating the difference between this interpolated layer and the elevation surface.

The resulting REMs enable us to visualize river corridors and highlight the local topographic features within them in a way that may be difficult to discern in a DEM or aerial imagery. The enhanced visualization of an REM facilitates the identification of important features for habitat and engineering assessments as well as for studies relating to flooding and river migration. Some of these features include oxbows, point bars, chutes, levees, back basins, meander scrolls, and head cut erosion.


What do you think of Relative Earth Model visualizations? Is there a particular river system that you would like to see visualized in this way? Let us know in the comments below!
About Caslys
For over 20 years, Caslys Consulting Ltd. has taken pride in offering a wide range of high-quality geospatial services for both environmental and natural resource management industries.
Our focus is on interpreting and analyzing data to deliver cost-effective solutions and help our clients make better informed decisions. We specialize in Geographic Information Systems (GIS), remote sensing, information management and application development to meet the needs of both public and private sector clients within Canada and abroad.
As a company, Caslys Consulting combines strong technical skills in our specialized fields with the ability to effectively communicate technical results and complex products to help show our clients how it can be used for meaningful decision making. We also understand the importance of sustainability and take pride in promoting sustainable initiatives and practices to help improve the communities we are working in.
Caslys Consulting Ltd. acknowledges and respects the Lək̓ʷəŋən peoples and W̱SÁNEĆ Nations on whose traditional territory the Caslys office is located. We thank them for their strength and resilience in protecting this land and aspire to uphold our responsibilities according to their example.
We want to hear from you! Connect with Caslys today to learn more about our services and how our spatial data specialists can help your projects succeed.