Remotely Piloted Aircraft System (RPAS) data processing
Caslys is pleased to offer professional RPAS data processing as a subcomponent of our CARD Stack services, applying custom built processing tools to efficiently handle large quantities of complex spatial data with speed and accuracy.
Why use Caslys to process your data?
-
RPAS data processing is often a challenging task that requires expertise. Using our services ensures that an experienced geomatics professional is generating and reviewing the data.
-
Caslys has the tools, experience, and skills to efficiently handle large and complex datasets of high-resolution imagery or point cloud data.
-
Save time, save money - our data processing methods are fast and efficient, often providing a cheaper solution then the cost of processing the data yourself.
Not only does Caslys process high quality RPAS data products, but we also offer an extensive library of derivatives and packages, further enhancing your project. Unlock the full potential of your data and get your clients the information they really need.
On top of data products, we offer consulting services where our drone and data experts can help you capture the data you need. Whether you are trying to figure out how to collect accurate LiDAR, or jumping into the world of multi-spectral sensors, our experts can help you find the right equipment, build the right workflow, and capture the data you need.
Most Popular Data Products
Spectral Data
-
Vegetation Indices: Normalized Difference Vegetation Index (NDVI)
-
Multispectral Indices: Greenness, Brightness, Wetness
-
Image Texture: Variance, Range
-
Wildfire and Regeneration Indices: Normalized Burn Ratio (NBR) Index
-
Change Monitoring & Temporal Trends
Advanced Data Derivatives
-
Canopy High Model (CHM) / Canopy Extent Shapes
-
Terrain Aspect in Degrees
-
Multi-Scale Topographic Position Index (TPI)
-
Slope
-
Terrain Depression Detection
-
Topographic Wetness Index (TWI)
-
Volumetrics
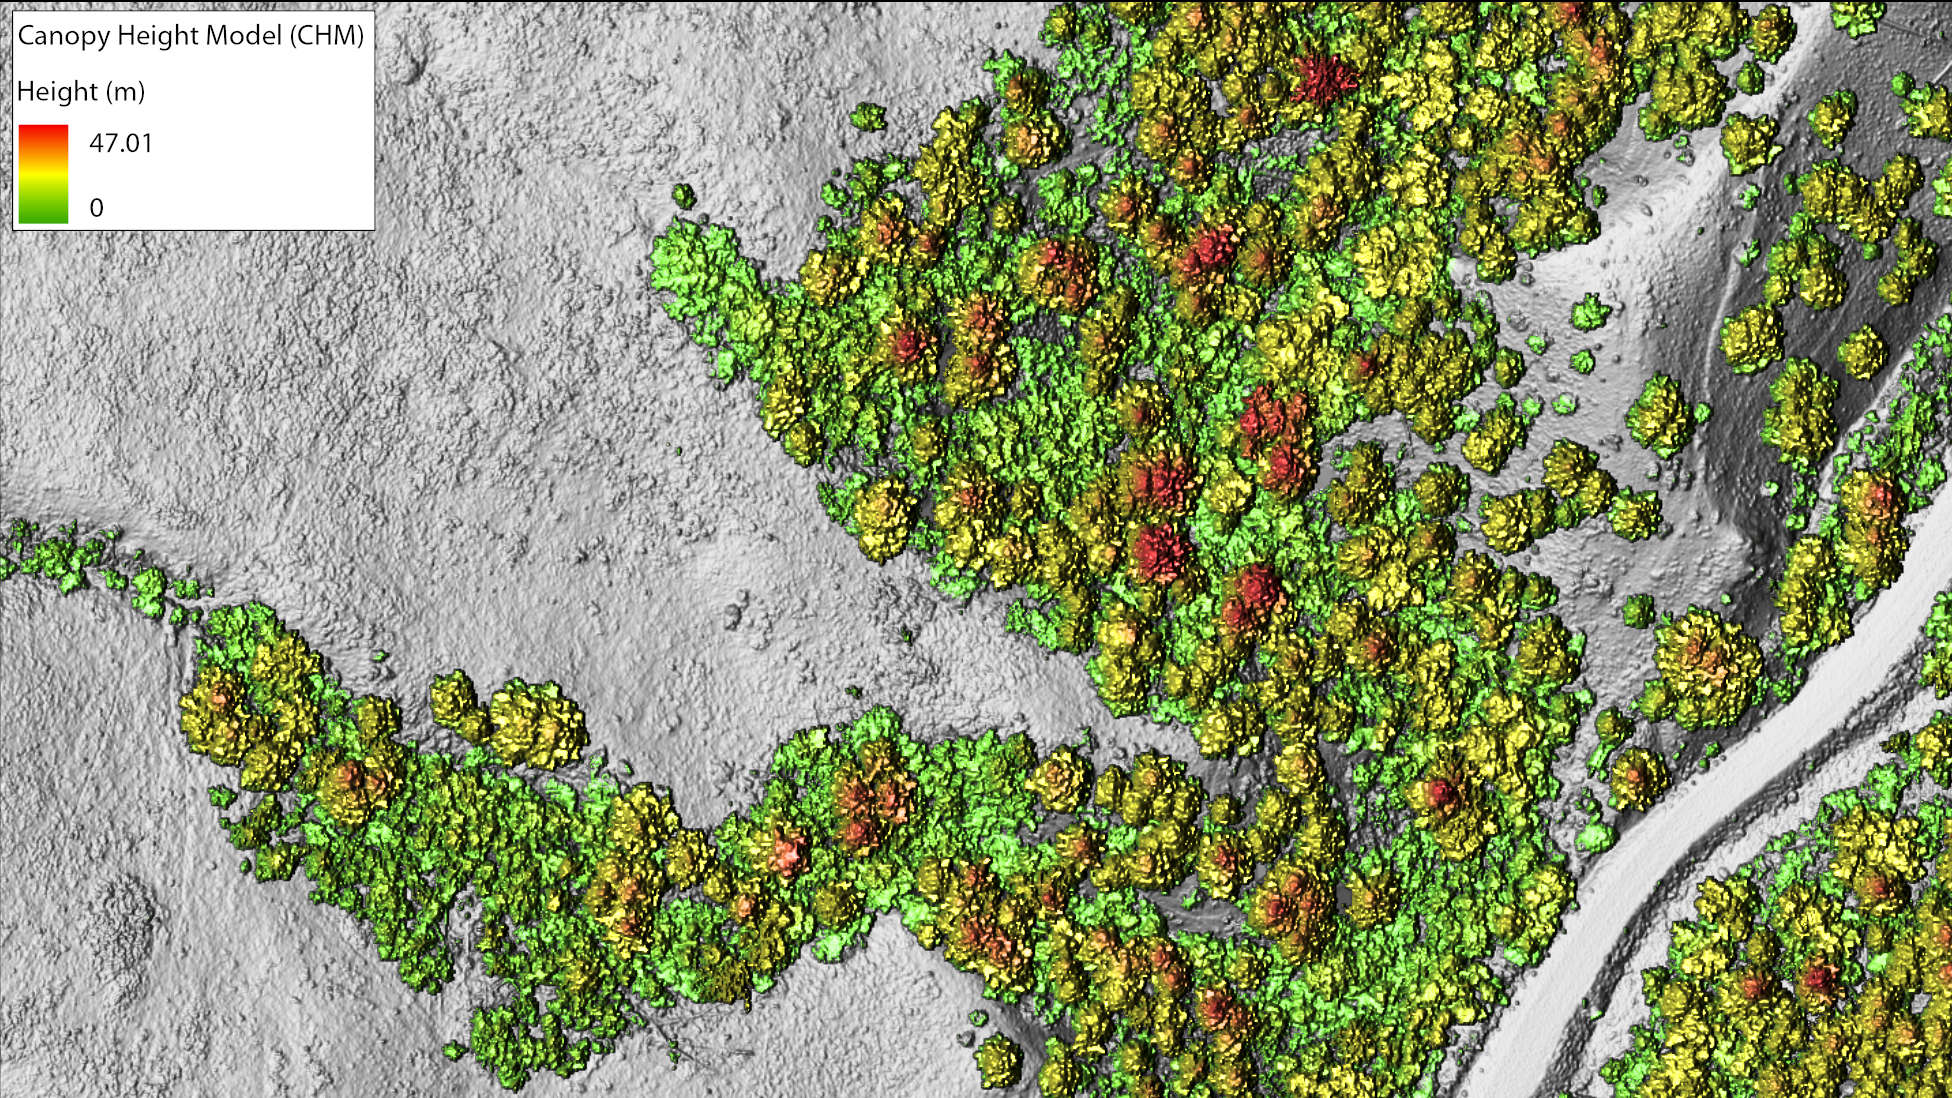
Canopy Height Model (CHM) / Canopy Extent Shapes
A Canopy Height Model (CHM) is a raster product created by subtracting the DSM from the DTM; this result leaves only the height above ground. In non-forest areas, this is also called a normalized DSM (nDSM), showing the elevation values normalized to the underlying terrain. A common use for this is identifying and classifying tree canopies. You can see the green polygons generated that delineate the tree canopy extents. Tree point features can also be generated.
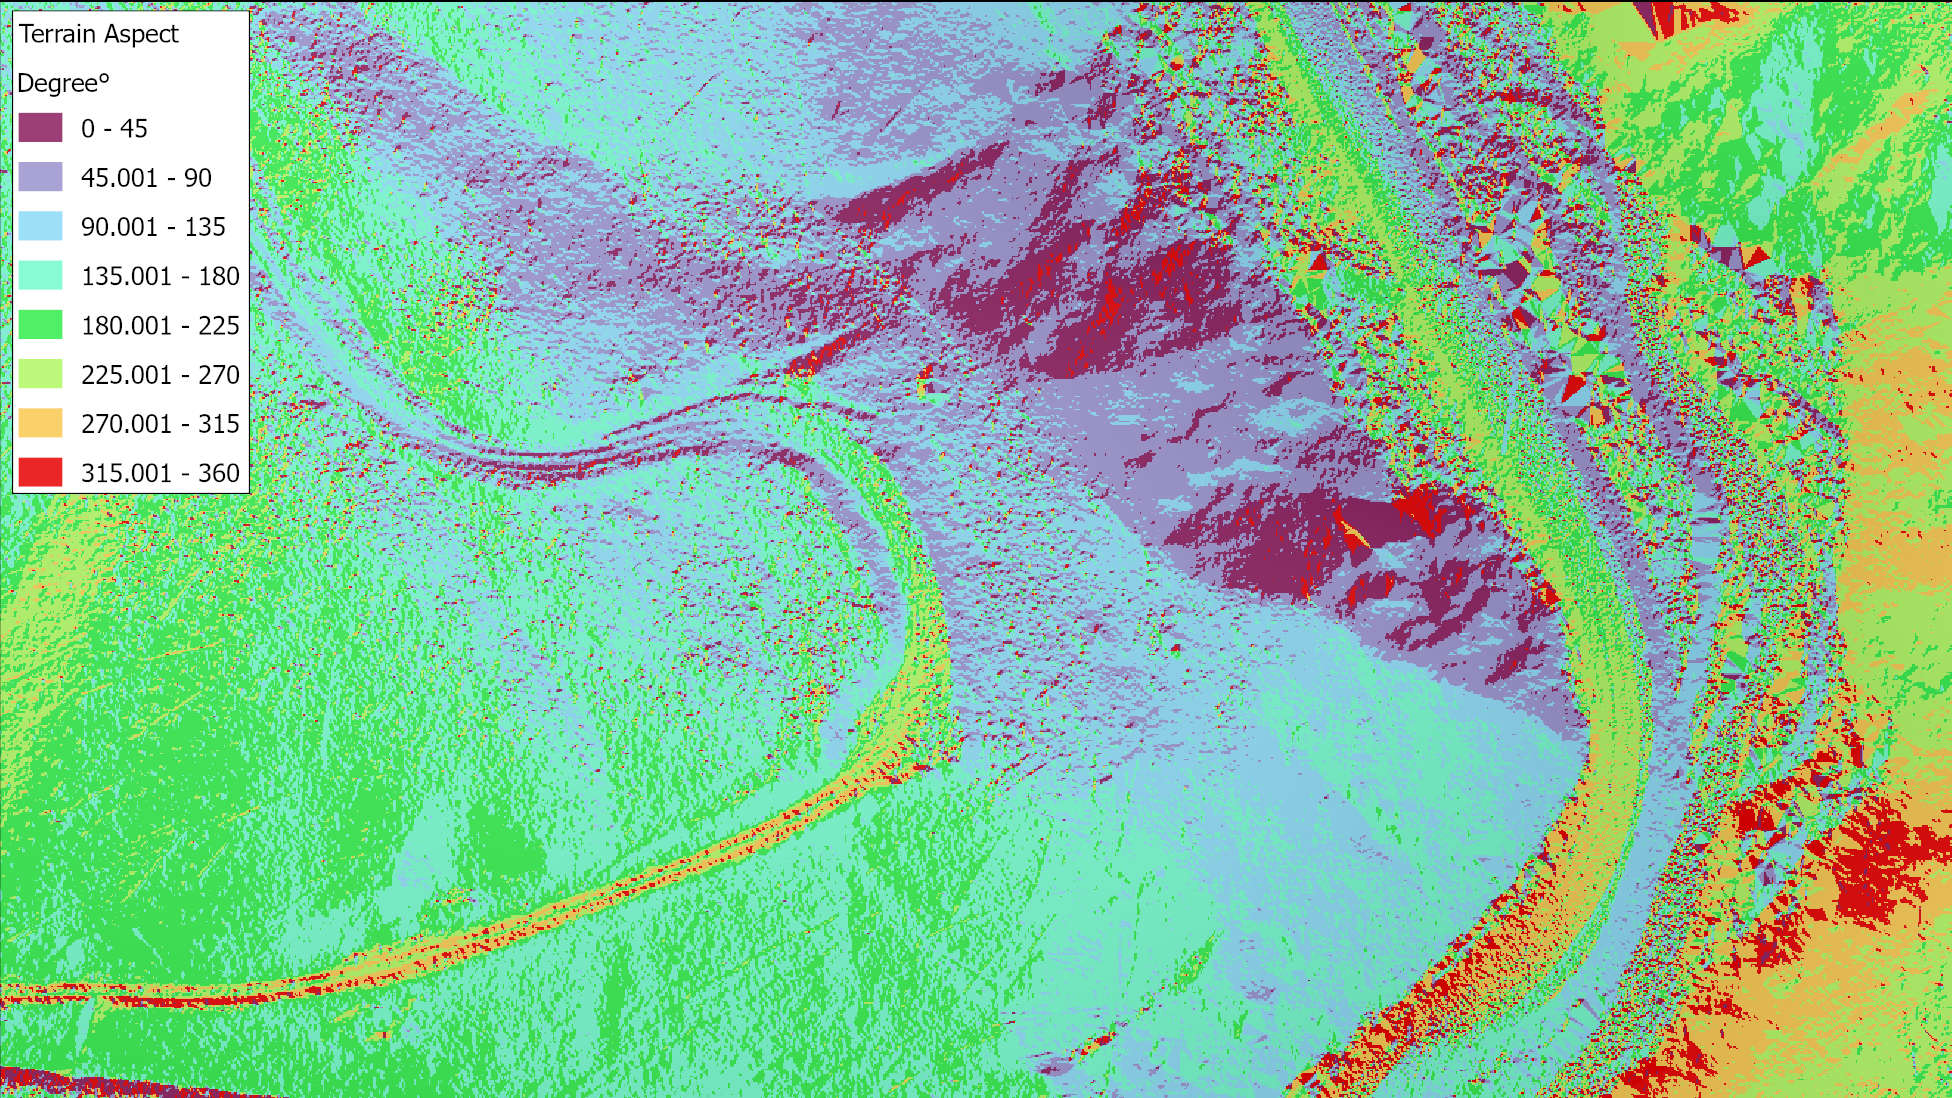
Terrain Aspect in Degrees
This is a type of raster that shows the compass direction that each slope in a terrain faces, measured in degrees from 0° (north) to 360° (north again). This information is useful for understanding sunlight exposure, wind patterns, and other environmental factors affecting the terrain. For example, if you are planting vegetation for remediation and want to identify a specific exposure, this product can be used to help identify build a planting prescription.
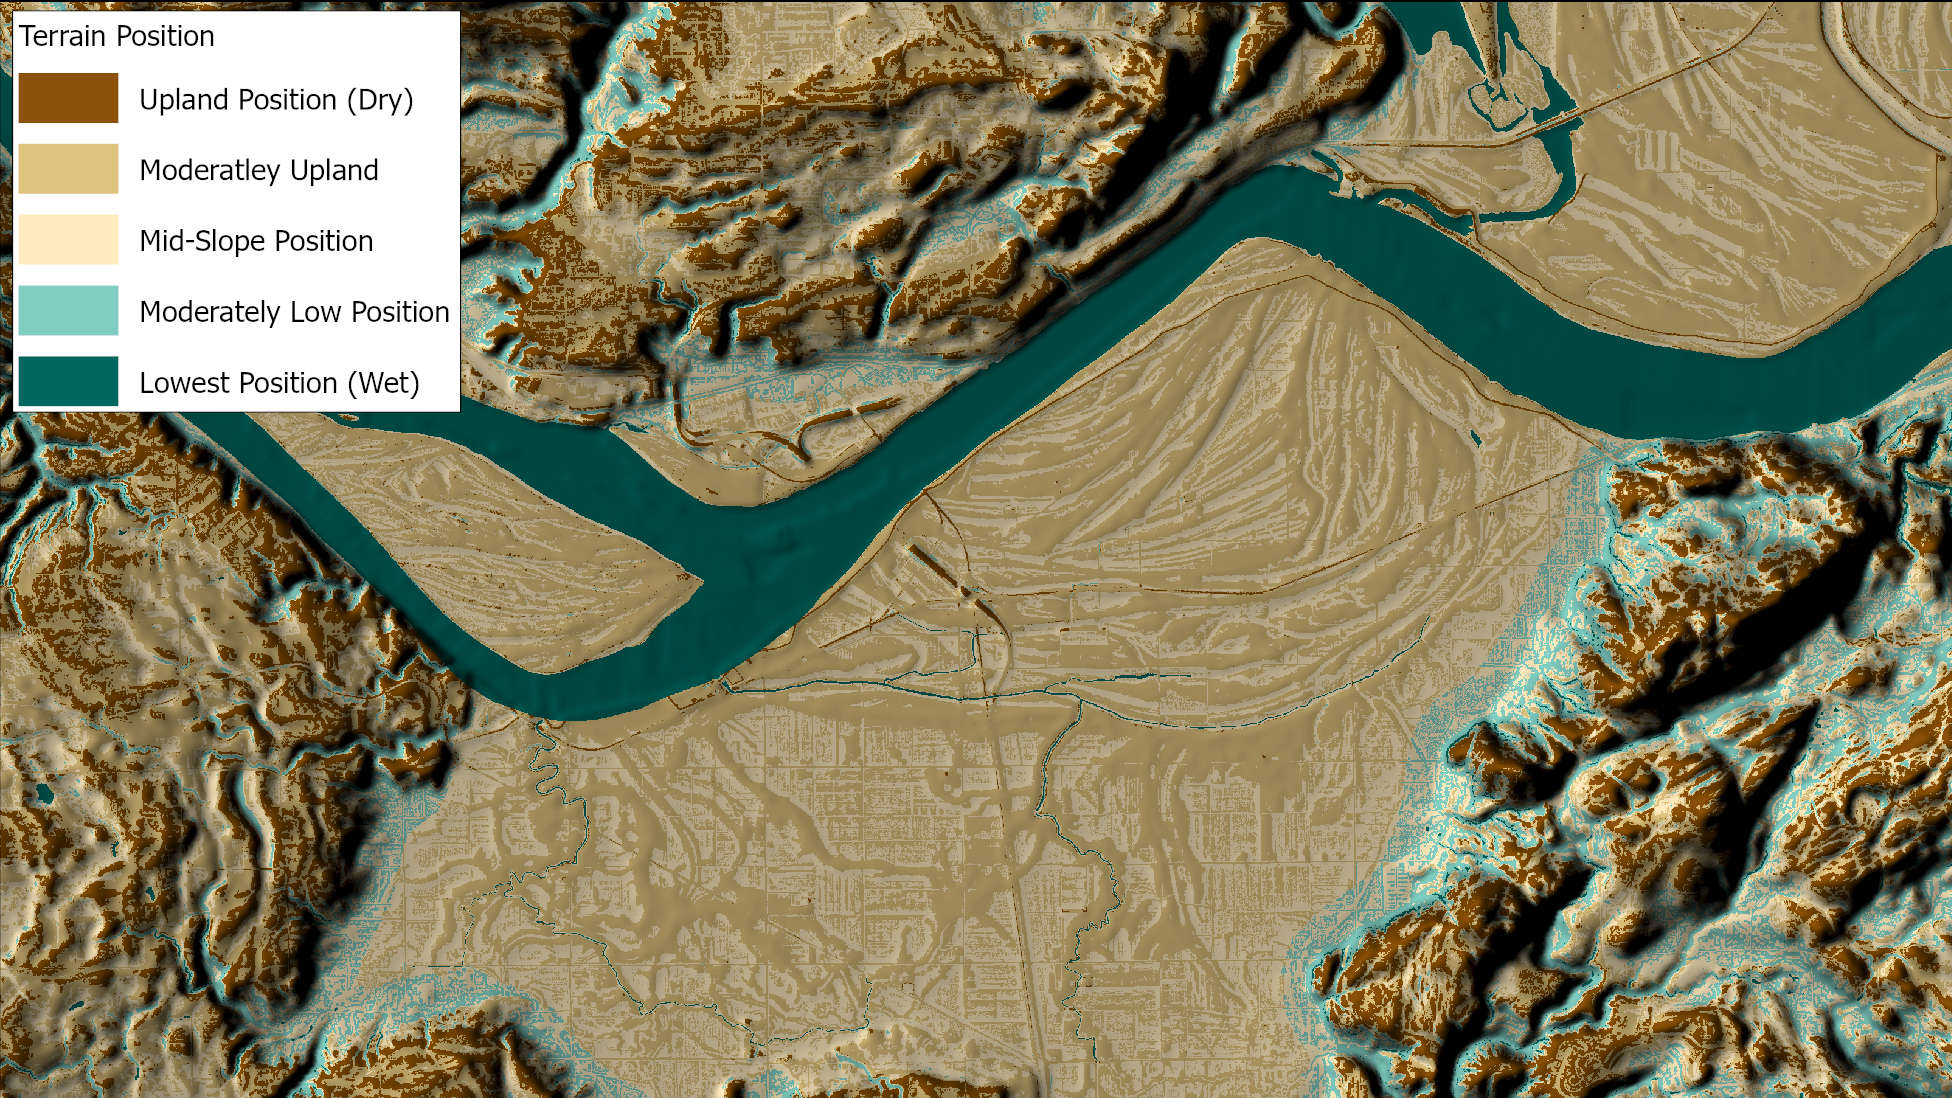
Topographic Position Index (TPI) – Multi-Scale
This derivative distinguishes topographic features such as uplands from other lower depressions or valleys. This is calculated by comparing the elevation of each pixel to its surrounding neighbors. This product can be used to analyze terrain for identifying landscape types that are common in certain areas; for example, lowland features have a higher likelihood of containing wetlands. This can also be a helpful visualization tool on maps.
TPI can be adjusted based on the size of the neighboring data. Decreasing this window increases the detail of the results but reduces the relative results across the study area, causing more intense differences to be identified.
With a small neighborhood value and high-resolution data, the results can become less valuable when working across a large study area; still it can be valuable when looking for small area changes.
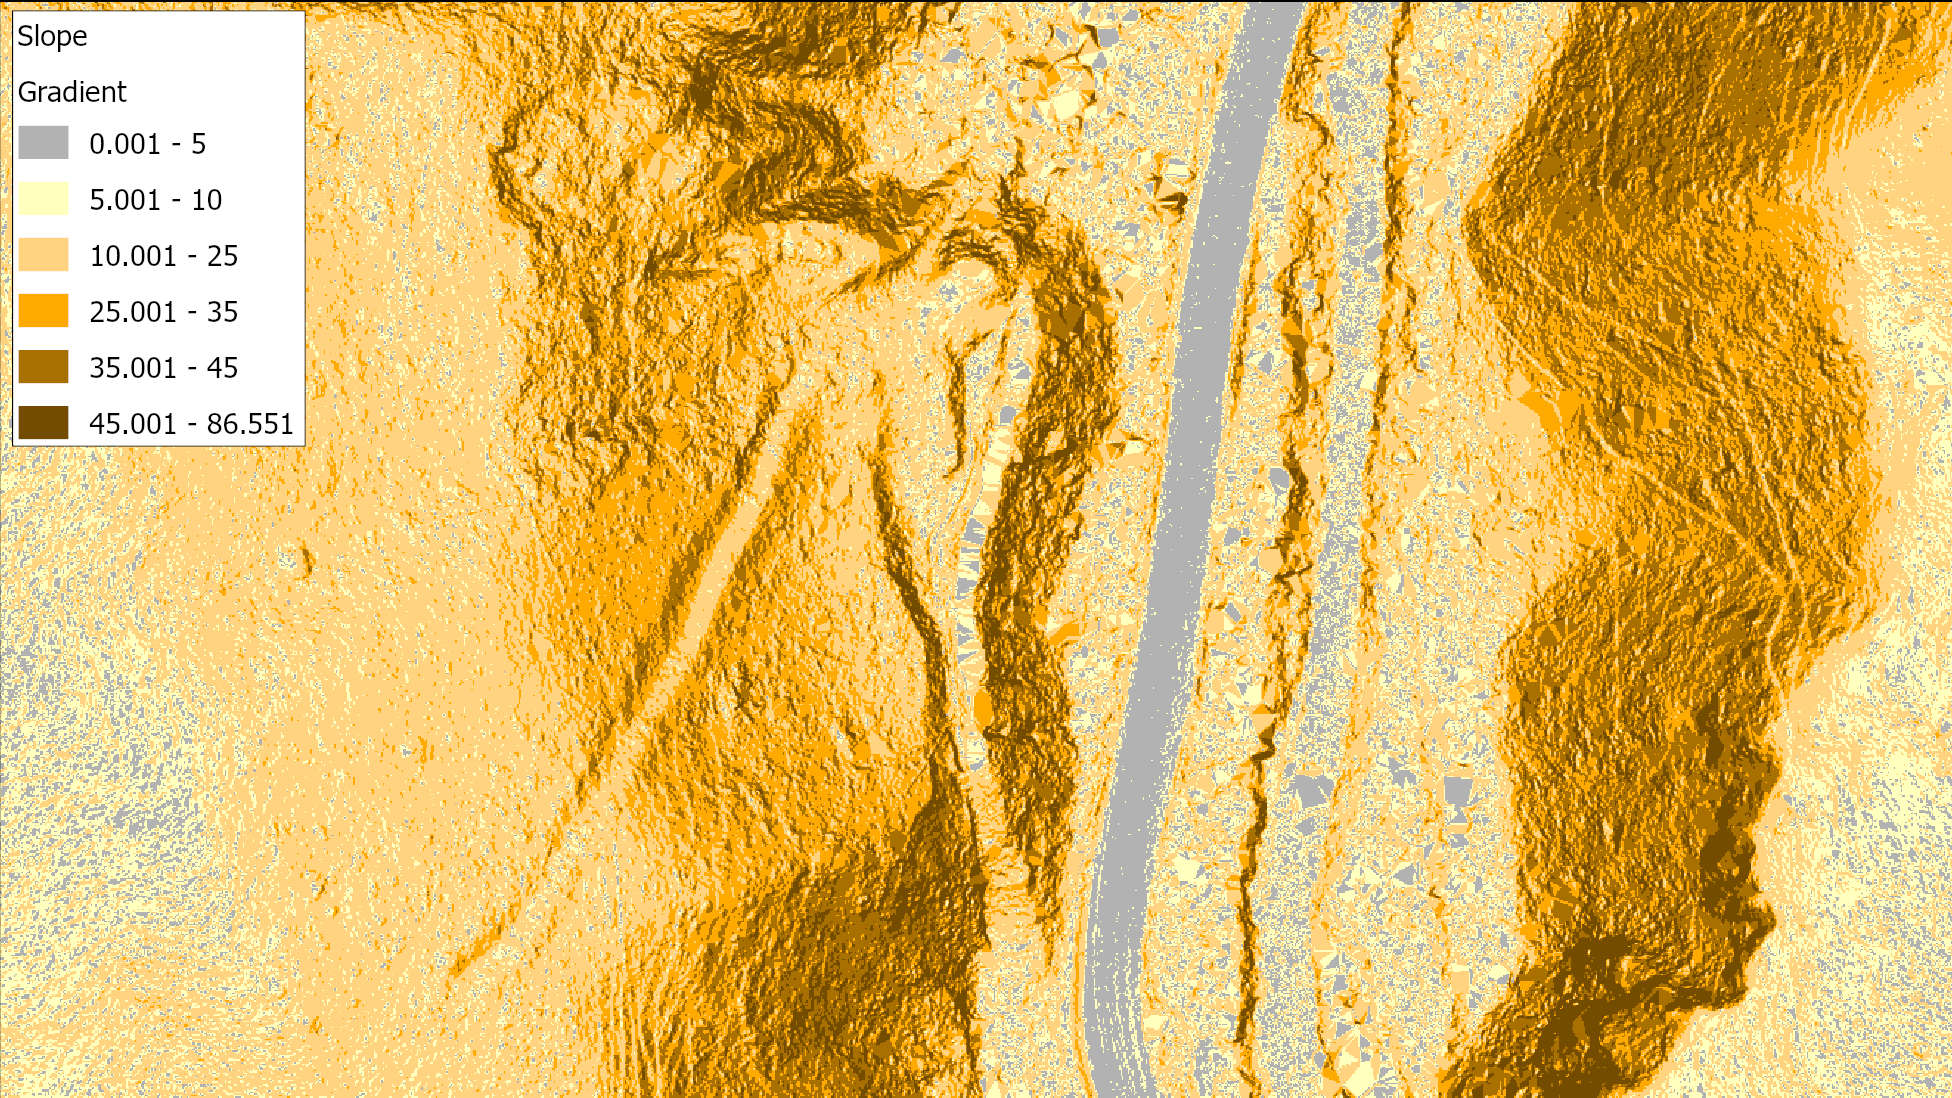
Slope
This is a measurement of the gradient or steepness of each cell of the raster dataset. The example provided is showing slope in degrees, but it can also be converted to percent slope depending on the needs of the client. This information can be used to identify hazard areas or areas of potential slope instability when paired with soil and vegetation coverage information. Slope can also be a critical layer when calculating riparian potential (another CARD Stack tool).
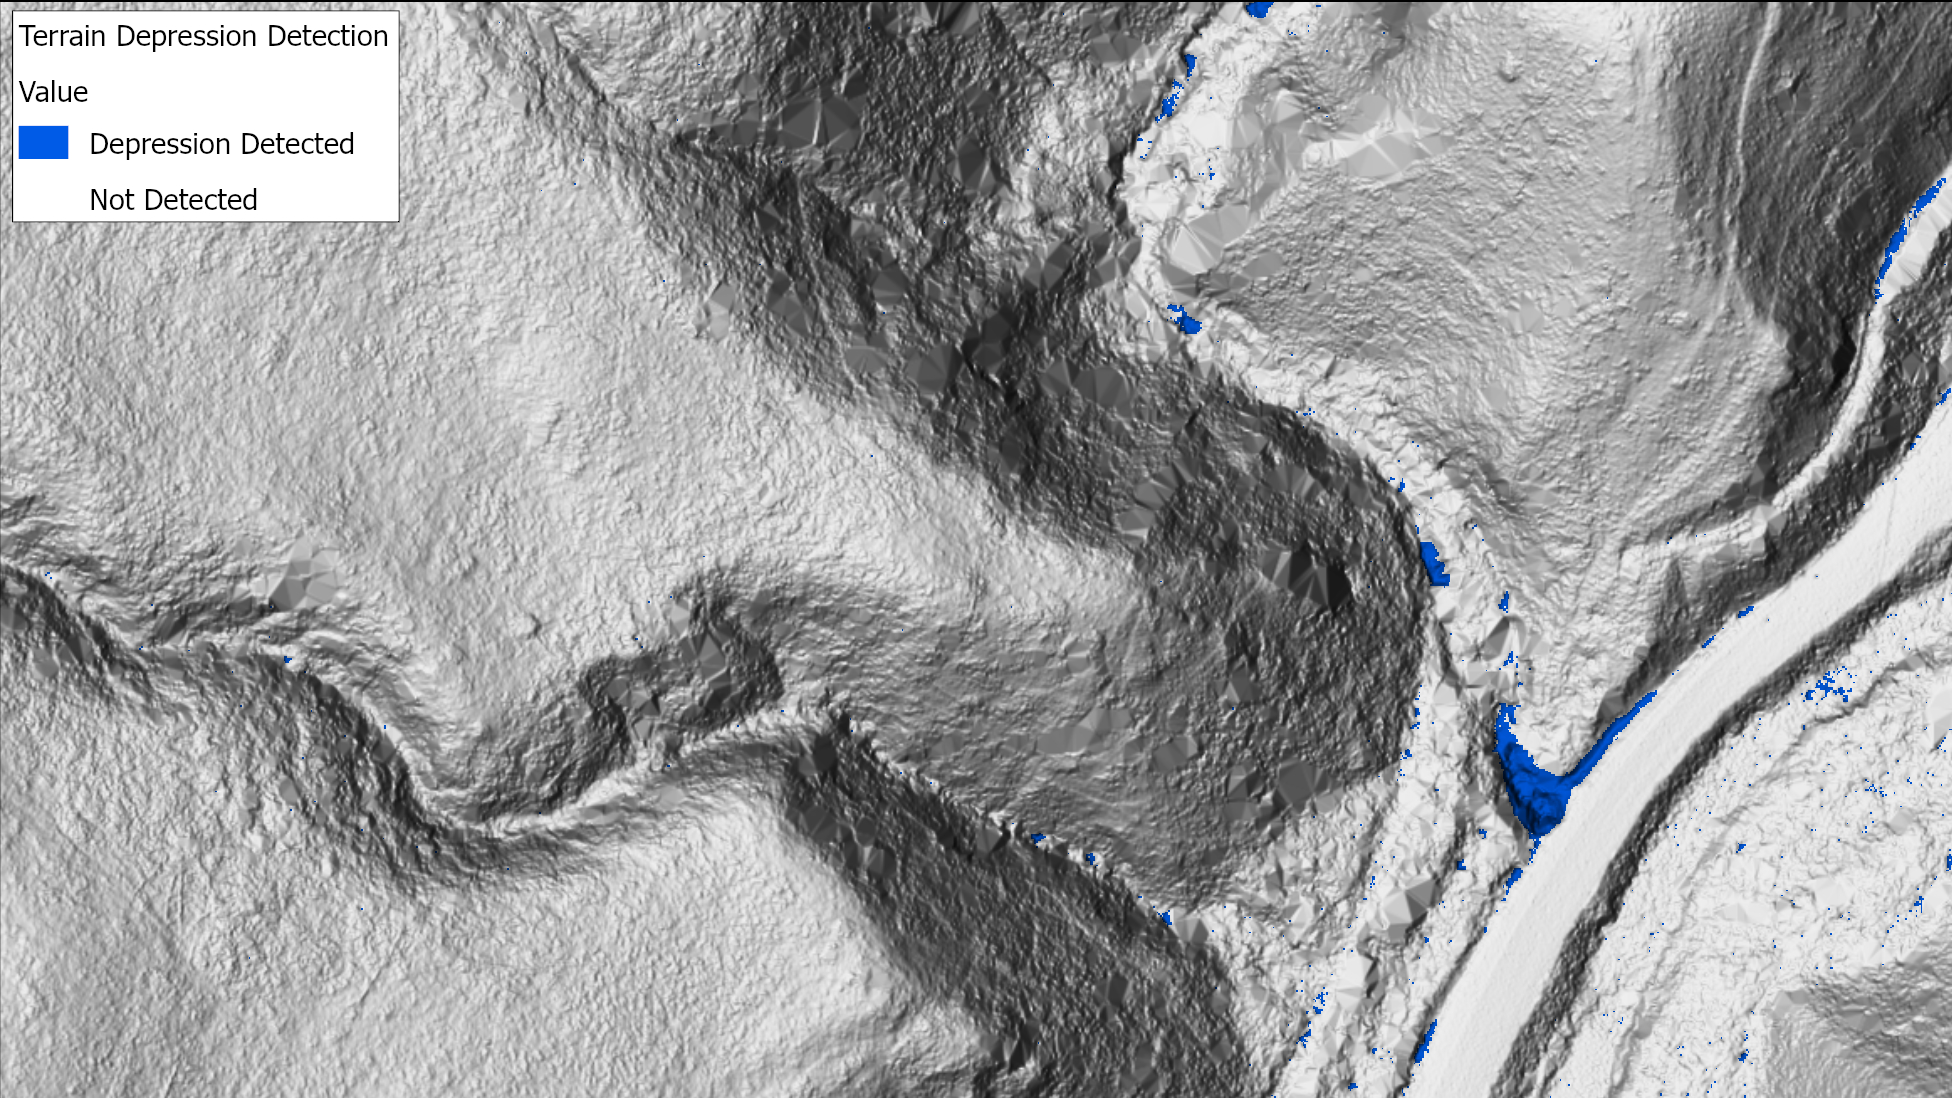
Terrain Depression Detection
This product uses surface elevation data to identify landscape depressions. This can be used to highlight areas where flow might accumulate and to identify depressions that may be hard to see from a visual review of a more basic derivative like a hillshade.
Topographic Wetness Index (TWI)
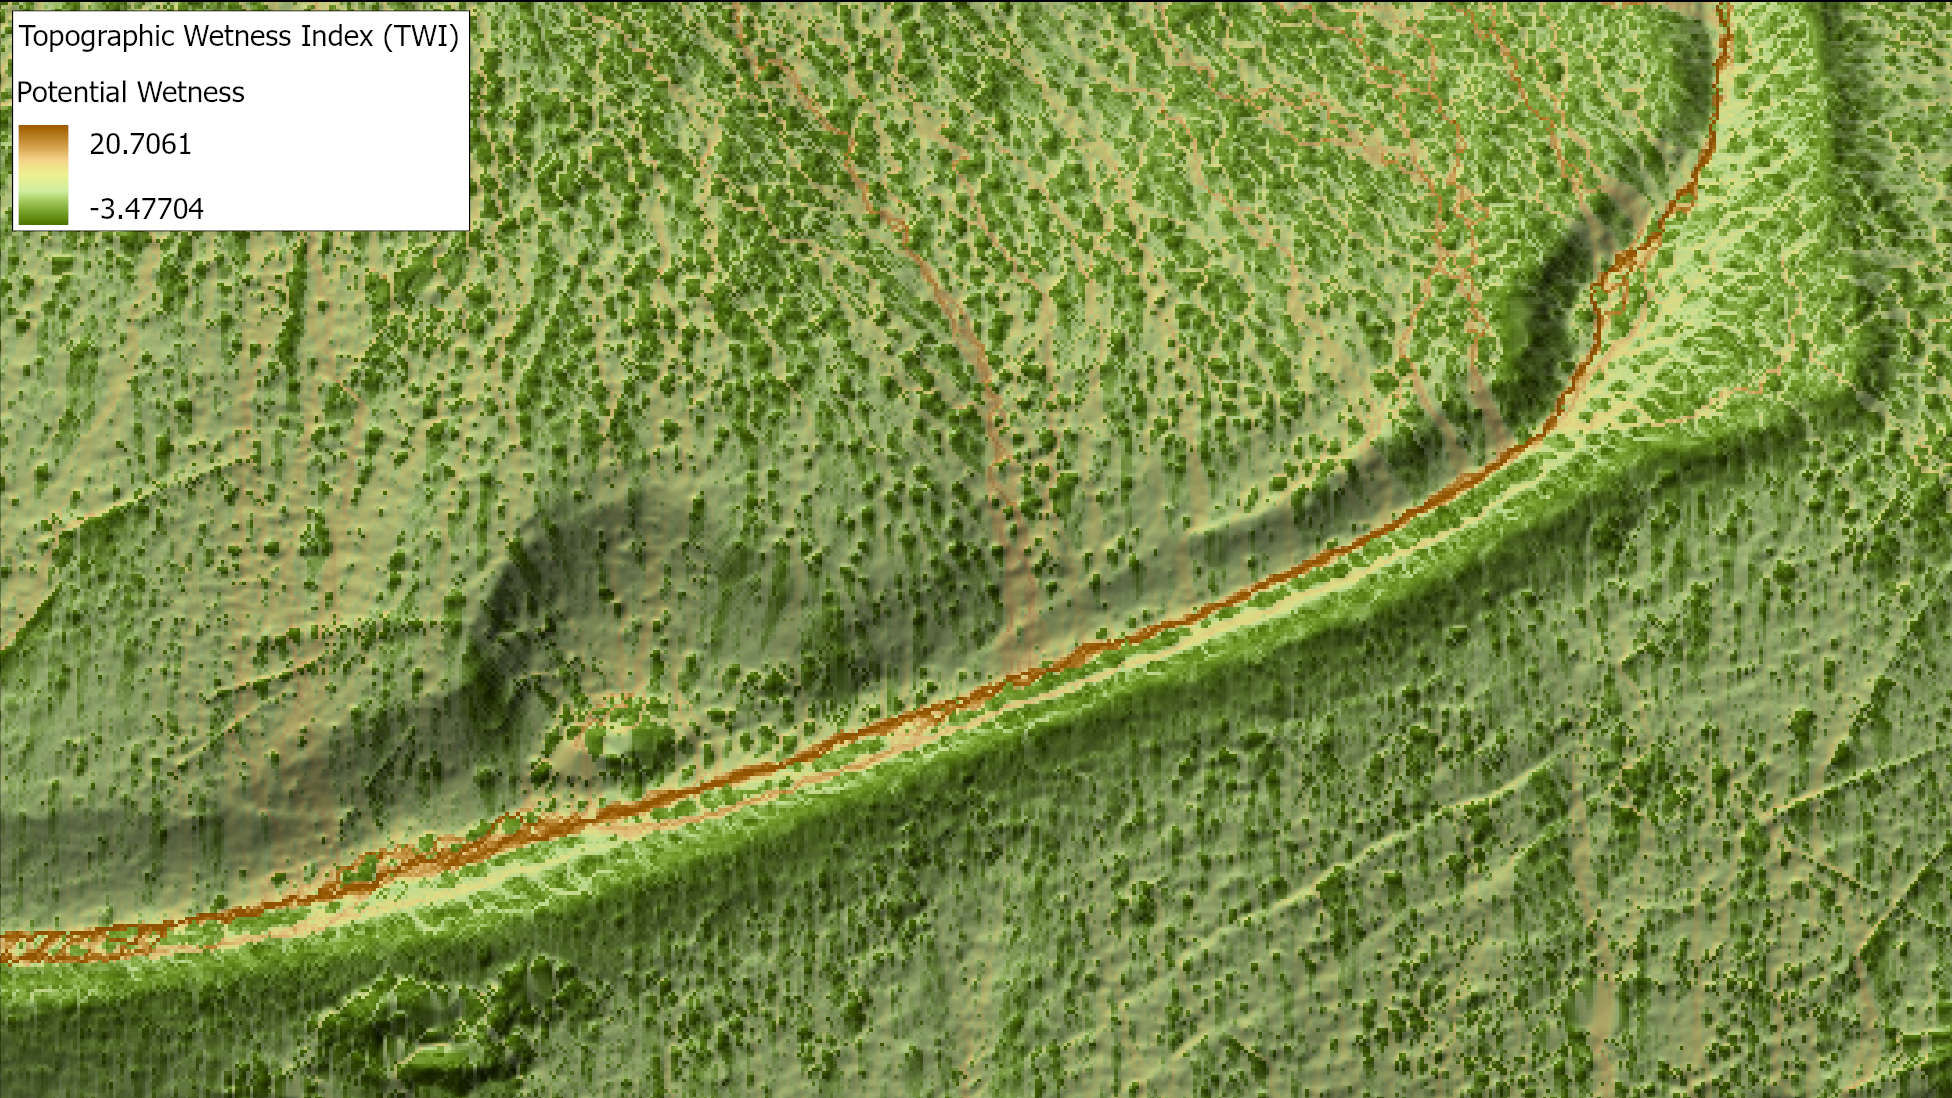
The TWI incorporates elements of flow accumulation and depression detection to create a data layer for identifying low-lying areas. It also separates a low area with less upstream catchment from a low area with a larger upstream catchment, making it a strong tool for analysis on wetlands and riparian identification.
Volumetrics and 3D Visualization
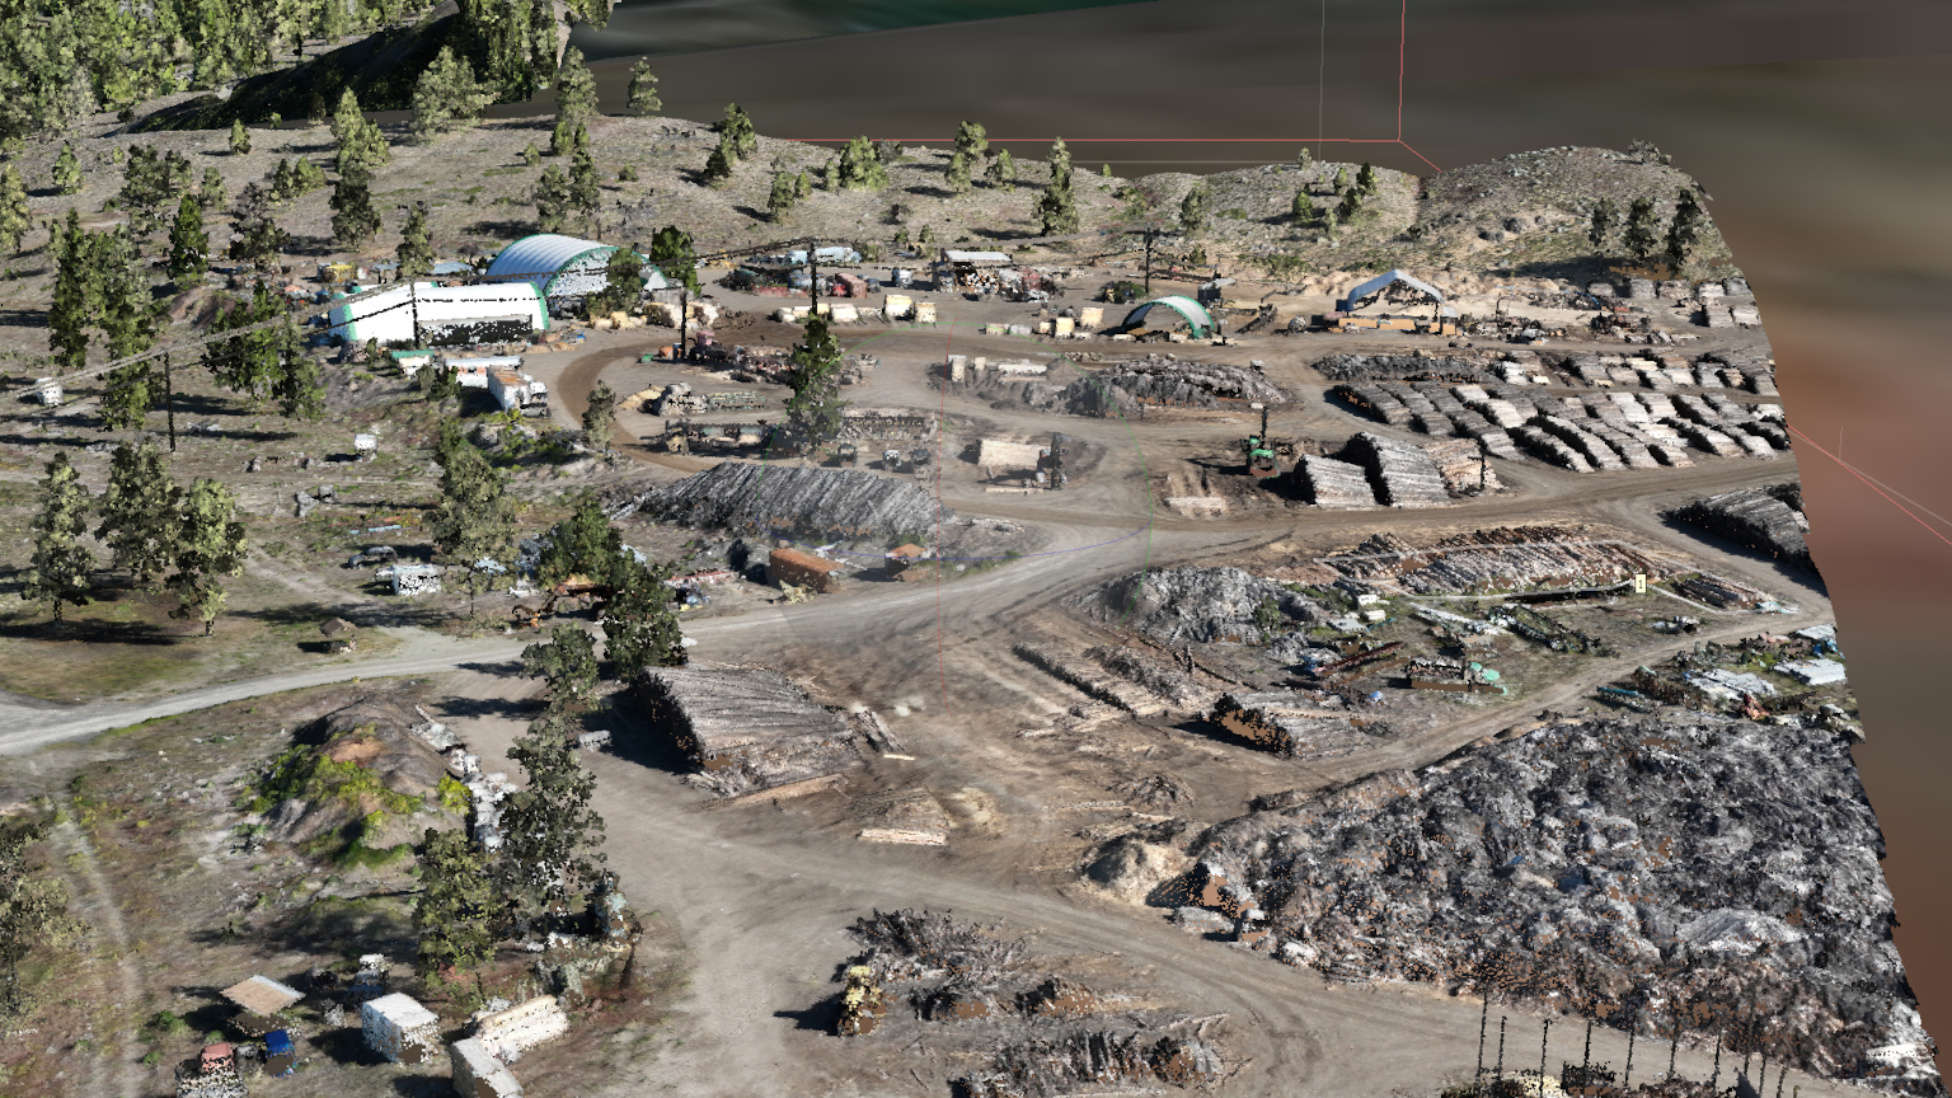
Volumetrics can be calculated using a mesh dataset generated from the source point data. Once a delineation of the target features is generated (either manually or through deep learning), a cut and fill attribute is calculated representing the area volume in m3.
This point data can be captured from LiDAR or imagery, and we offer photogrammetry processing as a service. Point cloud data can also be used to render 3D models and visualizations of features or landscapes. By generating mesh surfaces from the points, we can help provide a new perspective for marketing, planning, and public engagement projects.
Example data collected by Stinson Aerial Services Inc.
